A new benchmark study found that one AI agent answered questions about scientific chart values more accurately and at lower cost when it could read the papers’ source tables instead of estimating values from plots. In a separate 500-question test, the table-based setup scored 97.4% accuracy, compared with 90.0% for the plot-based setup, while cutting reported cost by 72%. The comparison applies to that agent configuration, not every AI model.
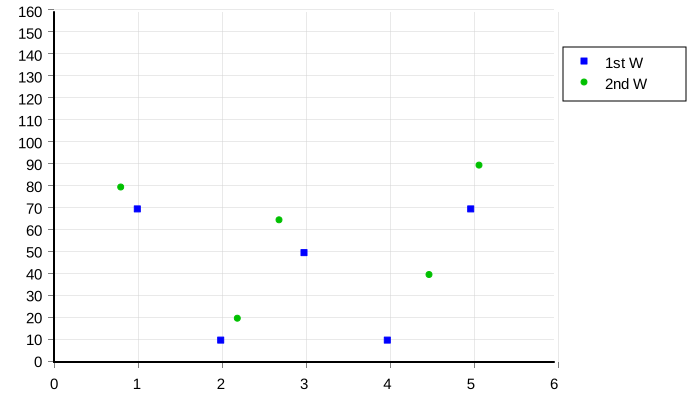
Reading a value from a chart means locating a mark and estimating its position against axes and tick marks. PlotGround, a pipeline introduced in the preprint, links selected figures in biology papers to the authors’ deposited tables, then turns those source values into questions with human review. That lets researchers test whether an AI can retrieve the number without reconstructing it from pixels.
The study’s broader PlotGround-1k benchmark contains 1,119 human-checked questions drawn from 1,066 bioRxiv preprints. Across 16 AI models designed to process both images and text, GPT-5.6 Sol had the strongest reported result at 87.5% when answers within 5% of the reference value counted as correct. At a tighter 2% tolerance, its score fell to 73.8%; all tested models lost between 11 and 24 percentage points as the tolerance tightened. The gap matters when a value is reused in quantitative work rather than treated as a rough visual estimate.
The table-versus-plot result came from a distinct agent experiment using Claude Code with Sonnet 5 on 500 questions. Its reported accuracy rose from 90.0% with full text and figures to 97.4% with full text and tables; average cost fell from $0.408 to $0.113 per question. The paper therefore supports a practical design choice for this workflow: retrieve underlying data when available, and reserve visual reading for cases where the values cannot be found in a table.
The benchmark is narrower than general scientific figure reading. It covers selected panels from biology preprints with deposited tables and questions whose values could be reconstructed unambiguously with simple operations; it tests individual points rather than full-series digitization. The work is an arXiv preprint, and the authors say the benchmark and pipeline will be released upon acceptance. A useful next test is whether the advantage holds across other fields, chart types and agents.
Sources
Illustration: “Charts SVG Example 4 - Simple Scatter Chart,” by Innesw, via Wikimedia Commons, licensed under CC BY-SA 3.0.
